Jan 132012
 

This spreadsheet contains the VBA code to write an Excel range as a clean, formatted HTML page, with optional auto-refresh.
NOTE If you click on the ‘This spreadsheet’ link above and it opens a ZIP file or a set of HTML files, right-click on the link and choose Save As.

Features:

  • Correctly renders all Excel formatting, including conditional formats.
  • Renders embedded charts.
  • Generates an HTML page with tabs identical to those in the Excel file.
  • Creates clean, formatted HTML that validates to HTML 4.01 strict.
  • Optimised stylesheet to ensure minimal page weight.
  • Supports merged cells with ROWSPAN and COLSPAN.
  • Updates the webpage automatically when cells’ values are changed.
  • The webpage automatically refreshes itself at a user-supplied interval.

The result is almost pixel-perfect, compare this Excel screenshot with the HTML page it generated.

14 March 2013. Update, improved lower tab bar to stop over-spilling (thanks to Paul Palmer) and added support for 64-bit Office.

21 August 2014. Many people have asked how to insert an image in the HTML page. It is not possible to get the contents of an embedded Excel image, but it is possible to get an embedded chart. Here’s how to perform this trick:

  1. In the sheet to be published, make sure no cells are selected
  2. Excel Menu->Insert->Chart and choose any chart type. This will insert an empty chart.
  3. Move and size the empty chart as required
  4. Select the chart by clicking its border
  5. Excel Menu->Layout and click the Picture icon
  6. Select an image file (JPG, BMP, etc) and Insert

28 September 2014. Now handles Unicode text correctly.

17 December 2018. Now outputs hyperlinks correctly.

Dec 232011
 

I though this would be trivial; turns out it’s not.

  • When you copy a formula from the clipboard, relative references are adjusted, so Range(x).Formula=Range(y).Formula doesn’t produce the expected results.
    The correct way is Range(x).Formula=Range(y).FormulaR1C1. Easy once you’ve been there.
  • Copying border formats with Range(x).Borders=Range(y).Borders crashes Excel. You have to copy each individual border, left, right, top, etc.
  • Similarly for fonts, you have to copy the font attributes one by one.
  • Good practice: check that the areas have compatible sizes and don’t overlap.

Nothing inordinately difficult, but time-consuming to get right. Here’s the code:

Option Explicit

' Copy cells without using the clipboard.
'
' Source is a range from which to copy values/formulas/formats.
' Dest is the destination range. Must be either
'     a single cell, the top-left of the target range. The source size (rows x columns) is copied.
'   or
'     a range exactly the same size as source. We throw an error if the shapes don't match.
'
' If 'what' is omitted, copies the values.
' what=CopyFormulas copies the formulas instead of the values.
' what=CopyFormats copies the formats.
' what=CopyFormulas+CopyFormats copies both.
'
' Examples:
'   CopyCells Range("b2:c6"), Range("h10")                                   ' Copies 8 cells (6x2) from B2 to H10
'   CopyCells Range(cells(2,2),cells(6,3)), Range("h10")                     ' Idem
'   CopyCells Range(cells(2,2),cells(6,3)), Range(cells(10,10),cells(14,12)) ' Fails, source is 6x2, dest is 6x3
'   CopyCells Range("b2:c6"), Range("b3")                                    ' Fails, source and dest intersect

Public Const CopyFormulas = 1
Public Const CopyFormats = 2
Public Sub CopyCells(source As Range, dest As Range, Optional what As Long)

    ' Turn off screen updating, wastes (a lot of) time
    Dim updating As Boolean
    updating = Application.ScreenUpdating
    Application.ScreenUpdating = False

    If IsMissing(what) Then
        what = 0
    End If

    Dim r As Long
    Dim c As Long

    ' If destination is not a singe (r,c) top-left cell, ensure that the ranges are the same shape and size
    If dest.Rows.Count > 1 Or dest.Columns.Count > 1 Then

        If dest.Rows.Count <> source.Rows.Count Or _
           dest.Columns.Count <> source.Columns.Count Then

            Err.Raise 1000, "CopyCells", "Destination area " & dest.Rows.Count & "x" & dest.Columns.Count & _
                " is not the same shape as the source area " & source.Rows.Count & "x" & source.Columns.Count

        End If
    End If

    If Not (Intersect(source, dest) Is Nothing) Then
            Err.Raise 1000, "CopyCells", "Source area " & Replace(source.Address, "$", "") & " " & source.Rows.Count & "x" & source.Columns.Count & _
                " intersects destination area " & Replace(dest.Address, "$", "") & " " & dest.Rows.Count & "x" & dest.Columns.Count
    End If

    For r = 1 To source.Rows.Count

        For c = 1 To source.Columns.Count

            If what And CopyFormulas Then
                dest.Cells(r, c).Formula = source.Cells(r, c).FormulaR1C1
            Else
                dest.Cells(r, c).Value = source.Cells(r, c).Value
            End If

            If what And CopyFormats Then

                Dim b As Long
                For b = xlEdgeLeft To xlInsideHorizontal
                    With source.Cells(r, c).Borders(b)
                        dest.Cells(r, c).Borders(b).Weight = .Weight ' You must do this *before* linestyle
                        dest.Cells(r, c).Borders(b).LineStyle = .LineStyle
                        dest.Cells(r, c).Borders(b).ColorIndex = .ColorIndex
                        dest.Cells(r, c).Borders(b).TintAndShade = .TintAndShade
                    End With
                Next
                dest.Cells(r, c).ColumnWidth = source.Cells(r, c).ColumnWidth
                dest.Cells(r, c).Interior.Color = source.Cells(r, c).Interior.Color
                dest.Cells(r, c).Interior.Pattern = source.Cells(r, c).Interior.Pattern
                dest.Cells(r, c).HorizontalAlignment = source.Cells(r, c).HorizontalAlignment
                dest.Cells(r, c).IndentLevel = source.Cells(r, c).IndentLevel
                dest.Cells(r, c).NumberFormat = source.Cells(r, c).NumberFormat
                dest.Cells(r, c).Orientation = source.Cells(r, c).Orientation
                dest.Cells(r, c).RowHeight = source.Cells(r, c).RowHeight
                dest.Cells(r, c).UseStandardHeight = source.Cells(r, c).UseStandardHeight
                dest.Cells(r, c).UseStandardWidth = source.Cells(r, c).UseStandardWidth
                dest.Cells(r, c).VerticalAlignment = source.Cells(r, c).VerticalAlignment
                dest.Cells(r, c).WrapText = source.Cells(r, c).WrapText

                With source.Cells(r, c).Font
                    dest.Cells(r, c).Font.Background = .Background
                    dest.Cells(r, c).Font.Bold = .Bold
                    dest.Cells(r, c).Font.Color = .Color
                    dest.Cells(r, c).Font.ColorIndex = .ColorIndex
                    dest.Cells(r, c).Font.FontStyle = .FontStyle
                    dest.Cells(r, c).Font.Italic = .Italic
                    dest.Cells(r, c).Font.Shadow = .Shadow
                    dest.Cells(r, c).Font.Size = .Size
                    dest.Cells(r, c).Font.Strikethrough = .Strikethrough
                    dest.Cells(r, c).Font.Subscript = .Subscript
                    dest.Cells(r, c).Font.Superscript = .Superscript
                    dest.Cells(r, c).Font.Underline = .Underline
                End With
                On Error GoTo 0
            End If

        Next
    Next

    Application.ScreenUpdating = updating

End Sub

Sub test()
    CopyCells Range("b2:c6"), Range("h10"), CopyFormulas + CopyFormats
End Sub
 

May 102011
 

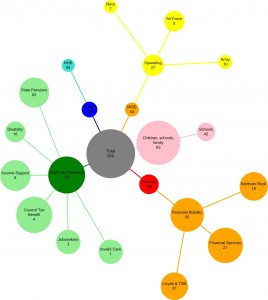
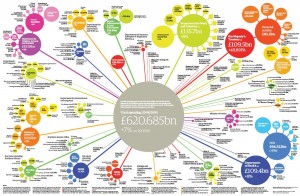
Pavel in St. Petersburg asked me if it would be possible to produce bubble diagrams like this in Excel:

UK Public Spending

Excel has had bubble diagrams sine 2003 but they are just an X-Y plot with variable-sized nodes. What Pavel was after is an automatic layout, with lines joining the nodes, along these lines:

Bubble diagram with Graphviz

Not perfect, but you get the idea, and it’s produced automatically. To do this, you’ll need Excel, Visio, Graphvizio and this zip file which contains the sample XLS, GV, VSD and JPG files.

  • Open the XLS. Column A is the node’s title, B is the title and the amount separated by a newline. Columns C, D and E specify the node’s parent, colour and amount. Column F computes the diameter of the node, in inches, from the amount:

Column G just creates Graphviz DOT statements from the values. G1 and G2 are the prelude. Copying column G into a text file called bubble1.gv, we get:

graph  RootGraph {
node [fontname=Arial, fontsize=12, style=filled];

"Total\n620" [width="3.1", height="3.1", color="gray", fillcolor="gray", shape=circle];

"Children, schools, family\n63"--"Total\n620" [color="pink"]; "Children, schools, family\n63" [width="0.315", height="0.315", color="pink", fillcolor="pink", shape=circle];

"Schools\n42"--"Children, schools, family\n63" [color="pink"]; "Schools\n42" [width="0.21", height="0.21", color="pink", fillcolor="pink", shape=circle];

...snip...

}

  • Fire up Visio. Graph>Diagram->Import Graphviz
  • To get the circular layout, Graph->Settings->Diagram->Concentric
  • Graph->Layout
  • A little tweaking of the font sizes and line thickness and you’re on your way

Enjoy!

Jan 082011
 

For those who envisage building an Excel RTD server, I have written a tutorial and open-sourced the code on SourceForge.

The following topics are covered:

  • How RTD servers work
  • Architecture
  • Excel, Multithreading and callbacks
  • Providing easy-to-read function names
  • Talking to the GoogleMaps APIs
  • Avoiding Application Domain misery
  • Embedding a GoogleMap page in an Excel Task Pane
  • Creating the Setup project
  • Changing the Excel RTD Throttle Interval
  • Utility functions
  • Building help from the source with Sandcastle

I hope that you will find it useful.

Oct 202010
 

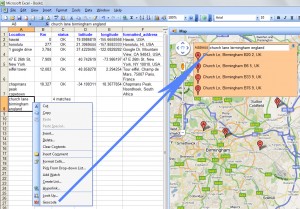
Addin for Microsoft Excel which allows you to perform forward and reverse geocoding, both by address and latitude / longitude, calculate Great Circle Distances using Vincenty’s algorithm, calculate travel distances and durations and verify the results with a Google Maps Task Pane, all inside your comfortable Excel interface.

This is useful for creating GoogleMap applications to find places from a list, like this.

Implements three Excel formulas:

=Geocode(request, location)

Request is the field to return:

  • status The status of the geocode request (Fetching, OK, N matches, etc.)
  • latitude The latitude of ‘location’
  • longitude The longitude of ‘location’
  • and so on: formatted_address, country political,administrative_area_level_1 political, administrative_area_level_2 political, administrative_area_level_3 political, locality political, sublocality political, route, street_number, postal_code, types, location_type, partial_match, point_of_interest, establishment, viewpointne, viewpointsw, airport establishment transit_station, bus_station transit_station, establishment, natural_feature, neighborhood political, postal_town, premise, street_address, subpremise

Location is the name or address of a place or point of interest

=GreatCircleDistance(latitude1, longitude1, latitude2, longitude2)

Calculates the Great Circle Distance using Vincenty’s Formula, with fallback to the Haversine formula when Vincenty’s method doesn’t converge.

=Travel(request, origin, destination, mode)

Calculates the distance or duration to get from origin to destination, according to Google Directions.

Request is the field to return:

  • distance The distance in metres from origin to destination
  • duration The estimated duration from origin to destination

Origin and destination are the names or addresses of the start and finish.

Mode is the mode of transport to use: Driving, Bicycling or Walking

Free download here

Enjoy!

Screenshot, click to enlarge:

Oct 162008
 

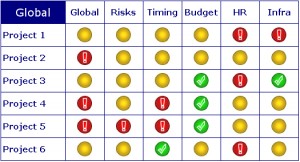
Many traffic-light solutions for Excel exist but all the ones I tried only work for a single light, and I needed an array like this:

I wanted to create a light by simply typing a formula in the light’s cell, with the colour of the light determined by a value in cell elsewhere. The light must change colour as soon as the underlying value changes. This wasn’t as simple to implement as I thought, but in the end a bit of VBA led to this formula :
=trafficlight(Sheet2!B4,Sheet2!B$3,Sheet2!C$3)
and the rest of the lights are created by dragging this formula right and down.

The parameters to the TrafficLight function are:

  1. The cell containing the value which determines the colour of the light.
  2. The threshold to change from red to amber.
  3. The threshold to change from amber to green.

in this example, the Sheet2 looks like this:

Project 1 has a value of 64 and thus is amber.

Here’s a ZIP file with the .XLS and the images project-progress-dashboard, feel free to use it as you see fit.

Notes:

  1. The red and green images have an exclamation mark and a tick superimposed so that they are recognisable on a black-and-white printout.
  2. You must keep the 3 GIF files in the same directory as the spreadsheet.
  3. There is one bug. If you resize a cell containing a light such that the light is no longer contained within the cell’s boundaries, the light will not be deleted when its underlying value changes (you end up with an orphaned light). To fix this, there is a “Remove lights” button; clicking it will delete all images and pressing F9 will re-generate correctly.