In the process of analysing a client’s existing database, I used Visio’s reverse-engineering tool. It works well, but the resulting diagram was an incomprehensible bowl of spaghetti. Visio does have a “Layout shapes” command, which appears to work by moving shapes with repulsive forces and the result is, not surprisingly, repulsive.
What I wanted was a tool which would unravel the spaghetti, so that I could get a grasp of the relationships, edit and revise them and layout again in an iterative process.
Searching for a solution, I found three layout programs, none of which have a Visio interface:
- Microsoft Automatic Graph Layout (MSAGL), formerly known as GLEE The first version, GLEE, is free whereas MSAGL costs between 99 USD and 279 USD depending on where you buy it.
- Tom Sawyer Layout is also a graph layout library, the price isn’t disclosed on their website.
- Graphviz from AT&T research labs, reputed to have the most sophisticated layout algorithms, is free.
Given that the best quality was to be found in the free library, I made the obvious choice.
It took me over a year and some 11’000 lines of VB to get Visio and Graphviz to co-exist; marrying a Unix-style command-line program with a WYSIWYG interface, both with quirks to numerous to mention, was far more challenging than I initially thought.
The result, unimaginatively called GraphVizio, is available here, I hope you’ll find it useful.
25 May 2011 Version 1.1.5 released. Improvements:
Full support for 64-bit Windows and Visio
No longer makes a Visio document ‘dirty’ when opening
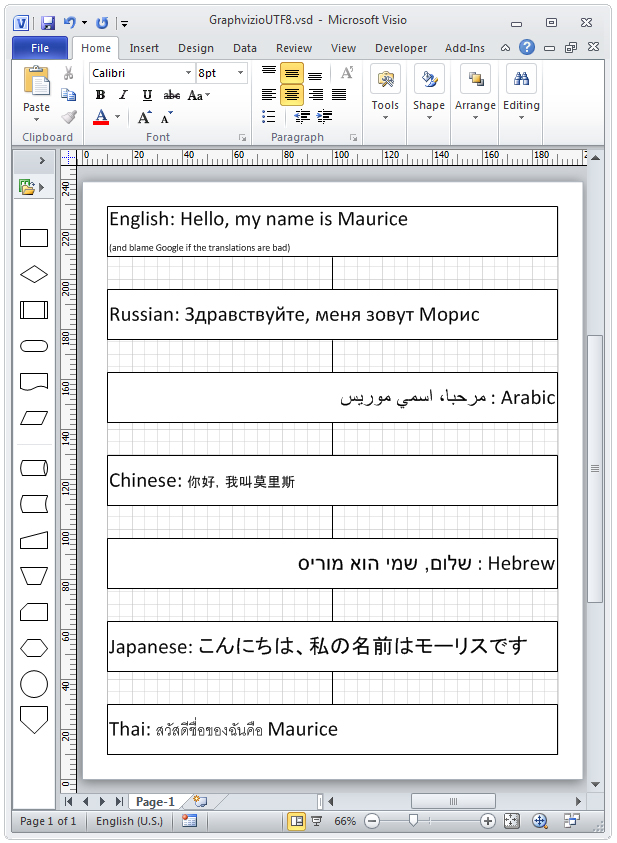
Full support for UTF8. This DOT file:
graph  RootGraph {
  node [width="7.08661417322834", height="0.787401574803148", color="#000000", fillcolor="#FFFFFF", fontname=Calibri, fontsize=24, style=filled, shape=box];
  edge [color="#000000", fillcolor="#FFFFFF"];

  "English: Hello, my name is Maurice\n(and blame Google if the translations are bad)" [pos="283.704566929134,620.932913385827", label="English: Hello, my name is Maurice\n(and blame Google if the translations are bad)"];
  "Russian: Здравствуйте, меня зовут Морис" [pos="283.704566929134,526.932913385827", label="Russian: Здравствуйте, меня зовут Морис"];
  "مرحبا، اسمي موريس : Arabic" [pos="283.704566929134,432.932913385827", label="مرحبا، اسمي موريس : Arabic"];
  "Chinese: 你好,我叫莫里斯" [pos="283.704566929134,338.932913385827", label="Chinese: 你好,我叫莫里斯"];
  "שלום, שמי הוא מוריס : Hebrew" [pos="283.704566929134,244.932913385827", label="שלום, שמי הוא מוריס : Hebrew"];
  "Japanese: こんにちは、私の名前はモーリスです" [pos="283.704566929134,150.932913385826", label="Japanese: こんにちは、私の名前はモーリスです"];
  "Thai: สวัสดีชื่อของฉันคือ Maurice" [pos="283.704566929134,56.9329133858268", label="Thai: สวัสดีชื่อของฉันคือ Maurice"];

  "English: Hello, my name is Maurice\n(and blame Google if the translations are bad)"--"Russian: Здравствуйте, меня зовут Морис";
  "Russian: Здравствуйте, меня зовут Морис"--"مرحبا، اسمي موريس : Arabic";
  "مرحبا، اسمي موريس : Arabic"--"Chinese: 你好,我叫莫里斯";
  "Chinese: 你好,我叫莫里斯"--"שלום, שמי הוא מוריס : Hebrew";
  "שלום, שמי הוא מוריס : Hebrew"--"Japanese: こんにちは、私の名前はモーリスです";
  "Japanese: こんにちは、私の名前はモーリスです"--"Thai: สวัสดีชื่อของฉันคือ Maurice";
}
produces this Visio diagram:
