In the process of analysing a client’s existing database, I used Visio’s reverse-engineering tool. It works well, but the resulting diagram was an incomprehensible bowl of spaghetti. Visio does have a “Layout shapes” command, which appears to work by moving shapes with repulsive forces and the result is, not surprisingly, repulsive.
What I wanted was a tool which would unravel the spaghetti, so that I could get a grasp of the relationships, edit and revise them and layout again in an iterative process.
Searching for a solution, I found three layout programs, none of which have a Visio interface:
- Microsoft Automatic Graph Layout (MSAGL), formerly known as GLEE The first version, GLEE, is free whereas MSAGL costs between 99 USD and 279 USD depending on where you buy it.
- Tom Sawyer Layout is also a graph layout library, the price isn’t disclosed on their website.
- Graphviz from AT&T research labs, reputed to have the most sophisticated layout algorithms, is free.
Given that the best quality was to be found in the free library, I made the obvious choice.
It took me over a year and some 11’000 lines of VB to get Visio and Graphviz to co-exist; marrying a Unix-style command-line program with a WYSIWYG interface, both with quirks to numerous to mention, was far more challenging than I initially thought.
The result, unimaginatively called GraphVizio, is available here, I hope you’ll find it useful.
25 May 2011 Version 1.1.5 released. Improvements:
Full support for 64-bit Windows and Visio
No longer makes a Visio document ‘dirty’ when opening
Full support for UTF8. This DOT file:
graph  RootGraph {
  node [width="7.08661417322834", height="0.787401574803148", color="#000000", fillcolor="#FFFFFF", fontname=Calibri, fontsize=24, style=filled, shape=box];
  edge [color="#000000", fillcolor="#FFFFFF"];

  "English: Hello, my name is Maurice\n(and blame Google if the translations are bad)" [pos="283.704566929134,620.932913385827", label="English: Hello, my name is Maurice\n(and blame Google if the translations are bad)"];
  "Russian: Здравствуйте, меня зовут Морис" [pos="283.704566929134,526.932913385827", label="Russian: Здравствуйте, меня зовут Морис"];
  "مرحبا، اسمي موريس : Arabic" [pos="283.704566929134,432.932913385827", label="مرحبا، اسمي موريس : Arabic"];
  "Chinese: 你好,我叫莫里斯" [pos="283.704566929134,338.932913385827", label="Chinese: 你好,我叫莫里斯"];
  "שלום, שמי הוא מוריס : Hebrew" [pos="283.704566929134,244.932913385827", label="שלום, שמי הוא מוריס : Hebrew"];
  "Japanese: こんにちは、私の名前はモーリスです" [pos="283.704566929134,150.932913385826", label="Japanese: こんにちは、私の名前はモーリスです"];
  "Thai: สวัสดีชื่อของฉันคือ Maurice" [pos="283.704566929134,56.9329133858268", label="Thai: สวัสดีชื่อของฉันคือ Maurice"];

  "English: Hello, my name is Maurice\n(and blame Google if the translations are bad)"--"Russian: Здравствуйте, меня зовут Морис";
  "Russian: Здравствуйте, меня зовут Морис"--"مرحبا، اسمي موريس : Arabic";
  "مرحبا، اسمي موريس : Arabic"--"Chinese: 你好,我叫莫里斯";
  "Chinese: 你好,我叫莫里斯"--"שלום, שמי הוא מוריס : Hebrew";
  "שלום, שמי הוא מוריס : Hebrew"--"Japanese: こんにちは、私の名前はモーリスです";
  "Japanese: こんにちは、私の名前はモーリスです"--"Thai: สวัสดีชื่อของฉันคือ Maurice";
}
produces this Visio diagram:

Graphvizio UTF8
Please show the contents of your .gv file
Visio 2013
Import .gv-file with any languages (example above in this page).
Error:
LexicalError in D:\TEMP\tmp227C.tmp.txt at line 23 column 1 token ”. Valid tokens : [no valid symbols]
Stack trace:
в GraphVizio.DotParser.ParseFile(String ifile)
в GraphVizio.DotParser.LoadDOT(String ifile)
в GraphVizio._ReadDOT.ReadDOT(String dotfile)
в GraphVizio._ImportDOT.ImportDOTandDraw()
в GraphVizio._ImportDOT._Closure$__._Lambda$__R2-1(Object& a0)
в GraphVizio.DispatchWithProgress_.Worker.DoWork(Object parameter)
Please, help!!!
Coudl you share the .GV file that you are trying to import please?
Need help ! I am importing .gv file. Running into below errror when importing
LexicalError in C:\Users\vbaxi001\AppData\Local\Temp\tmpC15B.tmp.txt at line 7 column 14 token ”. Valid tokens : [no valid symbols]
Stack trace:
at GraphVizio.DotParser.ParseFile(String ifile)
at GraphVizio.DotParser.LoadDOT(String ifile)
at GraphVizio._ReadDOT.ReadDOT(String dotfile)
at GraphVizio._ImportDOT.ImportDOTandDraw()
at GraphVizio.DispatchWithProgress_.Worker.DoWork(Object parameter)
Ah, I see. No, if you want to change shapes, you select the replacement shape in Settings->Shapes and Layout.
You can’t just select some shapes and change them without layouting.
It sounds like you aren’t editing the actual file C:\Users\[YOU]\AppData\Local\GraphVizio\GraphVizio\graphvizio\GraphVizio.css.
You need to open that GraphVizio.css, create/modify shapes on the page, drag hem back onto GraphVizio.css and save.
Sorry again if I wasn’t clear about workaround for non working icons. I meant if I create new graphviz file with the name of the icons I added to C:\Users\[YOU]\AppData\Local\GraphVizio\GraphVizio\graphvizio\GraphVizio.css? and then import that file with Graphvizio they will appear in the newly created diagram, but they still are not available under Graph->Settings->Shapes->Shape.
Sorry for late reply. I would like to change shapes and connector types without re-arranging them. But only button I can see is to apply those changes is “layout” which then will re-arrange and that is not what I want. I just want to change without re-arranging.
For example I would like new shapes. I choose the shapes I want, I click “layout” and then everything is re-arranged instead of only new shapes appearing.
Or I want to change connector type, I click “layout” and now everything is re-arranged instead of only connector types being changed.
As for icons, sorry I wasn’t clear, most of the times it will work, it just doesn’t work for some icons. For example “juniper general”. I found a workaround if I add these icons in graphviz file and create new file, they will appear, it just that they dont appear under Graph->Settings->Shapes->Shape.
Thanks for your help !
GraphVizio only re-arranges shapes and connectors when you click ‘Layout’.
Can you describe step-by-step what you do and what is not as you expect?
Are you sure you’re editing C:\Users\[YOU]\AppData\Local\GraphVizio\GraphVizio\graphvizio\GraphVizio.css?
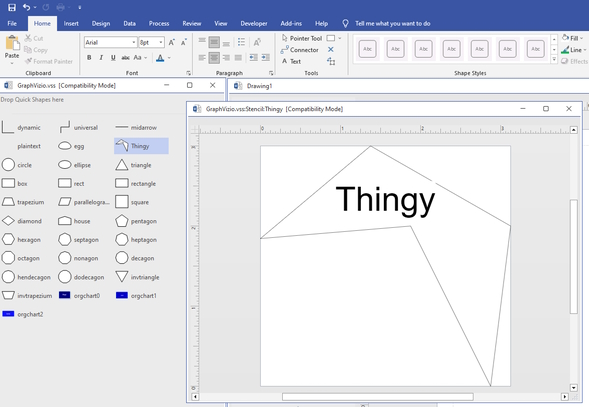
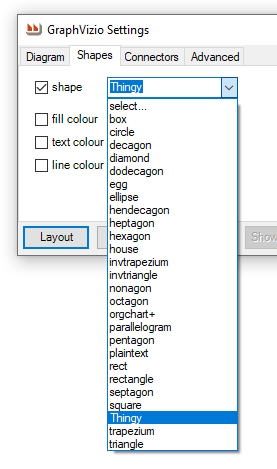
I create a new ‘thingy’ shape:
and it appears in shapes:
Thanks for quick response to my question about shapes. I have done everything correctly as far as I can see, but shapes don’t appear in Graph->Settings->Shapes->Shape. They do appear in graph/tools/stencil which means I did add them to the correct file.
Hello is it possible to make version which will not rearrange shapes when I make any change. For example I would like to change connectors and I have manually rearranged shapes ? Or is this already available but I can’t find it ?
You need to add your custom shapes to the GRAPHVIZIO.VSS file which is at C:\Users\[yourname]\AppData\Local\GraphVizio\GraphVizio\graphvizio.
Then your shapes will appear in the Graph->Settings->Shapes->Shape dropdown (but they will not appear in the Visio shapes).
Then, when you Layout! your shapes will replace all the existing shapes.
Hello, I am trying to use different shapes, for example juniper general, I add them to the graphvisio .vss file, and they are there, but don’t show in settings / shape. Any help is welcome
Sorry about that, there was a typo on the page, I’ve fixed it.
Is this still available? Your link takes me to a page that says the zip can not be downloaded.
Not sure that I understand. Could you give me a detailed example of exactly what you would like?
Not sure if this is still hosted here or elsewhere..
But a “nice to have” would be to be able to pass data through to Visio – maybe via the comment attribute
The binaries are there: https://github.com/smirkingman/GraphVizio/tree/main/GraphVizio/bin/Release
In principal it should work with all versions of Vizio.
Are you able to upload the release binaries to github as well?
What versions of Visio does it work with now?
I have published the latest version of the source on Github :
This software is just what I’m looking for, Thank you!
I’ve started looking at WireViz to generate diagrams and wanted to use GraphVizio to import that into Vizio to create a complete drawing.
I would like to build GraphVizio myself (for security reasons) and am OK purchasing Addin Express, however, I noticed that the source code on SourceForge is V1.1.8. Would you be able to post an updated archive?
Cheers!
So I can confirm that Graphviz 2.38 is ok (neato.exe is part of the package).
I found two small issues:
– when uninstalling Graphvizio, it doesn’t delete the path setting associated to GraphViz location. So when I rerun the tutorial, it always point on the first location set for GraphViz and didn’r reask for it. I workaround this by renaming the folder name of the former location of Graphviz 2.44 so that Graphvizio prompted me again for the location of Graphviz on tutorial rerun. I would suggest that at uninstall you would erase this setting (I looked with regedit, but couldn’t find such key), so that if the end user re-install Graphvizio, he can again point on a new location for Graphviz (or propose the default location inside Program Files).
– at GraphVizio install there’s a dialog asking if we want GraphViz to be installed from a known location. This fails. Apparently the download site page has changed and Graphvizio installer is not able to download the install package for Graphviz (that’s my understanding of the error message).
Again, thanks for your work.
First thanks for this very interesting add-in.
During the tutorial the add-in asked for the location of Graphviz. Which I did. It went through the tutorial until a point where a new modal window asked again for the location of neato.exe. I looked at \bin folder contents of graphviz, and didn’t find that executable. I only found lneato.exe. I quickly copy/paste lneato.exe to neato.exe, re-indicated the same path as before. But apparently these two executables are not for the same purposes. At least there were errors with some of the parameters passed to neato.exe.
I downloaded this version 2.44.1 from graphviz website:
https://www2.graphviz.org/Packages/stable/windows/10/msbuild/Release/Win32/
Apparently this release doesn’t contain anymore neato.exe but lneato.exe.
I found a version 2.38 of Graphviz which does contain neato.exe and I will retry with this one.
Again thanks for your work.
Kind regards.
Gabriel.
I have modified GraphVizio so that when it can’t find the GraphViz folder, it will prompt for it.
The selected value is visible in Addins->GaraphVizio->Tools->Options.
You will need to re-install this latest version from
Graphvizio is free software, you can use it for any purpose you see fit, with no restrictions.
However, it uses Graphviz so you must respect their license too https://www.graphviz.org/license/
Try clicking the cross button, top right in one of the tutorials window. God will surely forgive you for missing this obvious clue >;-}
.gv and .dot are equivalent.
The default is .gv because.dot was already used for MSWord templates.
If you could share the .gv you’re trying to import, I should be able to help you.
Even the sample file content listed above on this web page as “Working”, this plugin fails in the latest 64-bit Visio with an error when imported. I don’t even see a spot to import DOT files, just GV files but it appears to be the same thing.
LexicalError in C:\Users\rross\AppData\Local\Temp\tmpD3C.tmp.txt at line 23 column 1 token ”. Valid tokens : [no valid symbols]
Stack trace:
at GraphVizio.DotParser.ParseFile(String ifile)
at GraphVizio.DotParser.LoadDOT(String ifile)
at GraphVizio._ReadDOT.ReadDOT(String dotfile)
at GraphVizio._ImportDOT.ImportDOTandDraw()
at GraphVizio.DispatchWithProgress_.Worker.DoWork(Object parameter)
Good Lord, how do you STOP the tutorial?! This is really intrusive. Make the tutorial optional or at least offer an easy way to stop it. It has taken over my computer and literally won’t stop.
Can you please provide me with the license agreement or let me know whether I can use the license for commercial purposes?
I believe what John asked for, on April 1 2019, is the same feature that Robert Cowham says he implemented in his version of GraphVizio.
In GraphVizio 1.1.9.0, under Graph | Tools | Options, there’s a check box named ‘Update Whilst Drawing’. Un-checking the box seems to update the diagram only after the Nodes are drawn. It would be even better if the user could suppress drawing updates until all of the Edges are drawn– otherwise a Visio with 1,000s of lines (Edges) can take several hours to draw.
I’m a big fan of GraphVizio, it has really helped me draw network diagrams using Python to generate .gv files.
Sorry, I don’t understand.
At what point is the screen updating troublesome?
What do you mean by ‘pre-positioned’?
Maybe easier to drop me an email
maurice AT calvert DOT ch
Hello Maurice,
Is there any chance you can make a version which disables screen updating prior to running the script?
I believe the VBA equivalent is Application.ScreenUpdating = False.
This really helps when trying to import large files (1000+ nodes) which are already pre-positioned.
Thanks,
John
The addin uses the GraphViz DLL, which AFAIK is only available as 32-bit.
Sorry about that.
Maurice,
I am very happy to have found your plugin, but I am getting the incorrect format message:
An attempt was made to load a program with an incorrect format.
I don’t see the plugin in the com configuration app. I have tried with both Visio 2010 and Visio 2013 (Both 64 bit) . Any assistance pointing me in the right direction would be greatly appreciated.
-Mark Adams
Add-in Express Loader Log File: 01/02/2019 10:53:25:279
Startup directory: C:\Users\maadams\AppData\Roaming\GraphVizio\GraphVizio\
Loader version: 7.4.4067.0
Operating System: Microsoft (build 15063), 64-bit
Process Owner: Administrator
Command Line: “C:\Program Files\Microsoft Office\Office15\VISIO.EXE”
Run ‘As Administrator’: No
Process Elevated: No
Integrity Level: Medium
UAC (User Account Control): On
————————————————————————
10:53:25:279 4088 12556 Start.
10:53:25:279 4088 12556 Reading the registry key ‘HKEY_CLASSES_ROOT\CLSID\{D283F458-E634-4533-980E-895FC25CA800}’
10:53:25:279 4088 12556 Success. The registry key ‘HKEY_CLASSES_ROOT\CLSID\{D283F458-E634-4533-980E-895FC25CA800}’ is closed.
10:53:25:279 4088 12556 Converting the ‘{4BA250A6-8BCA-46A6-982A-F340081187C3}’ CLSID from string.
10:53:25:279 4088 12556 Success.
10:53:25:279 4088 12556 Attempting to get the class object by the ‘{4BA250A6-8BCA-46A6-982A-F340081187C3}’ CLSID.
10:53:25:279 4088 12556 Success.
10:53:25:279 4088 12556 Creating a new instance of the add-in loader.
10:53:25:279 4088 12556 Loading mscoree.dll
10:53:25:279 4088 12556 Success.
10:53:25:279 4088 12556 Loading the configuration from the system registry.
10:53:25:279 4088 12556 Getting the latest CLR version.
10:53:25:279 4088 12556 The latest CLR version is ‘v4.0.30319’.
10:53:25:279 4088 12556 The configuration has been loaded successfully.
10:53:25:279 4088 12556 Runtime version: v4.0.30319.
10:53:25:279 4088 12556 Assembly name: GraphVizio, PublicKeyToken=90375AEB2CF04584.
10:53:25:279 4088 12556 Class name: GraphVizio.AddinModule.
10:53:25:279 4088 12556 Registry key: CLSID\{D283F458-E634-4533-980E-895FC25CA800}.
10:53:25:279 4088 12556 Attempting to create a new instance of the managed add-in class: CLR – v4.0.30319
10:53:25:279 4088 12556 Loading CLR: v4.0.30319.
10:53:25:279 4088 12556 Calling CLRCreateInstance method.
10:53:25:279 4088 12556 Success.
10:53:25:279 4088 12556 Calling GetRuntime method.
10:53:25:279 4088 12556 Success.
10:53:25:279 4088 12556 Checking if the hosting API of .NET Framework v4.0 beta is installed.
10:53:25:325 4088 12556 The hosting API is up to date.
10:53:25:325 4088 12556 Calling GetInterface method for the CorRuntimeHost interface.
10:53:25:325 4088 12556 Success.
10:53:25:325 4088 12556 Starting CLR…
10:53:25:325 4088 12556 Success.
10:53:25:325 4088 12556 Getting the CLR version.
10:53:25:325 4088 12556 The CLR v4.0.30319 has been initialized successfully.
10:53:25:325 4088 12556 Creating a new domain setup.
10:53:25:325 4088 12556 Success.
10:53:25:325 4088 12556 Getting the add-in directory.
10:53:25:325 4088 12556 Success. The directory is ‘C:\Users\maadams\AppData\Roaming\GraphVizio\GraphVizio\’
10:53:25:408 4088 12556 The ‘shadow copy’ is enabled.
10:53:25:411 4088 12556 Creating a new application domain.
10:53:25:556 4088 12556 Success.
10:53:25:556 4088 12556 Creating an instance of the managed class. Assembly identity: ‘GraphVizio, PublicKeyToken=90375AEB2CF04584’
10:53:25:587 4088 12556 An attempt was made to load a program with an incorrect format.
I’m afraid that records don’t have an equivalent in Visio, sorry.
Hi,
thank you for developing this tool. It works fine for most Graphviz files. I especially like that you can move nodes in Visio and all arrows stay attached.
Unfortunately, some Graphviz files can’t be opened, I get the error “Port specifications not supported, sorry”. Can you give me an estimation of how much work I would have to invest to make it work? And how difficult would it be to support record-based nodes?
Best
Alexander
There was a link to this picture https://i.imgur.com/NBOxhAz.png in my previous post. I tried to include the image but I failed. Please see the link for the error message
OK I have determined that one of the things that was crashing my import was the fact that the graph had no name. I am using pygraphviz to generate my dot/gv files and the script is fine with the graph having no name
This morning I tried to import some graphs that succeeded the day before yesterday they crashed with the same error like below. I was using layers and a very complex graph. I went back to a simple test .dot file that I was going to send you but which had layers. That one started crashing too. I removed the layers and restarted Visio The crashing stopped. I added the layers back and it still worked. I was puzzled. I went back to my complex file and I tried to import that one and that one worked too.
I will continue to work with your addon and I will get back to you with a file that indeed does not work no matter what
The second issue that I noticed is that the error message is saying that the addon looks for the vss in another folder
It should be c:\Users\….\AppData\Roaming\GraphVizio\GraphVizio\graphvizio\GraphVizio.vss
Note: I have not managed to identify the problem with my system (windows 7) but I got your addon working on a vanilla windows 10 system with the same Visio 2010
Same error I guess, can you send me the DOT file please?
thanks and regards,
Maurice
Hi CuriousC
look like a syntax error.
could you send me the DOT file that you are trying to read please?
I’ll do my best to see what’s wrong.
Thanks and regards,
Maurice
Tried again on Windows 8 server with Vision 2010 x32 and graphviz downloaded by Graphvizio and I am getting this error
SyntaxError in C:\Users\Administrator\AppData\Local\Temp\2\tmp9AC9.tmp.txt at line 0 column 15 token ‘-, ‘+’, float, integer, stringlit, variable’. Valid tokens : [no valid symbols]
Stack trace:
at GraphVizio.DotParser.ParseFile(String ifile)
at GraphVizio.DotParser.LoadDOT(String ifile)
at GraphVizio._ReadDOT.ReadDOT(String dotfile)
at GraphVizio._ImportDOT.ImportDOTandDraw()
at GraphVizio.DispatchWithProgress_.Worker.DoWork()
Hi Maurice
Can’t say how happy and unhappy I am that I found your adon
Happy because there is hope
Unhappy because the adon does not work in my case
Here is my adxloader https://pastebin.com/Y5X68bL0
Here is my adxregistrator https://pastebin.com/YTpbdUeA
I am running Visio 14 x86 on Windows 7 x64 with Graphviz 2.38 x86
No matter how simple my file is when I try to load it via the Graph–>Diagram–>Import ..
Here is what I see https://i.imgur.com/IDAsYmm.png
I am also seeing a .Net error (in Event Viewer) like below
Application: VISIO.EXE
Framework Version: v4.0.30319
Description: The process was terminated due to an unhandled exception.
Exception Info: System.InvalidOperationException
at System.ThrowHelper.ThrowInvalidOperationException(System.ExceptionResource)
at System.Collections.Generic.Stack`1[[System.Int32, mscorlib, Version=4.0.0.0, Culture=neutral, PublicKeyToken=b77a5c561934e089]].Pop()
at GraphVizio._EndTXN.EndTXN(Boolean)
at GraphVizio.DispatchWithProgress_+Worker.DoWork()
at System.Threading.ThreadHelper.ThreadStart_Context(System.Object)
at System.Threading.ExecutionContext.RunInternal(System.Threading.ExecutionContext, System.Threading.ContextCallback, System.Object, Boolean)
at System.Threading.ExecutionContext.Run(System.Threading.ExecutionContext, System.Threading.ContextCallback, System.Object, Boolean)
at System.Threading.ExecutionContext.Run(System.Threading.ExecutionContext, System.Threading.ContextCallback, System.Object)
at System.Threading.ThreadHelper.ThreadStart()
Do you have any suggestion for fixing my issue ?
Looks like a permissioning problem. Are you a local administrator on your PC?
Could you look in “My Documents”, there should be a folder called “Add-in Express”. Could you send me the two log files please?
maurice AT calvert DOT ch
If you are interested, further to my last comment, here is the DistributedCOM error log:
“The application-specific permission settings do not grant Local Activation permission for the COM Server application with CLSID {8D8F4F83-3594-4F07-8369-FC3C3CAE4919} and APPID {F72671A9-012C-4725-9D2F-2A4D32D65169} to the user NT AUTHORITY\SYSTEM SID (S-1-5-18) from address LocalHost (Using LRPC) running in the application container Unavailable SID (Unavailable). This security permission can be modified using the Component Services administrative tool.”
I hope this helps. -Eric
Hello Maurice and Mathias,
I can confirm the last comment: adxloader64.dll –> “Not loaded. A runtime error occurred during the loading of the COM Add-in”
Microsoft Visio Professional 2016
Windows 10 Professional 64-bit
GraphVizio build date: 2014-10-16
We would love to see this working in the latest version of Visio. Let me know how I can help you. -Eric
Hi Mathias,
I’m sorry it didn’t work out, yes, 32 and 64 bit versions are supported. Could you send me an email with the details of the error (screenshot, version of Windows & Visio, etc) you receive please?
MAURICE at CALVERT dot CH
Sorry, no, simply because your desire to make Neato the default will conflict with [Some-other-guy]’s desire to have hierarchical as the default.
Hi Maurice ,
First of all I would like to thank you for offering us this opportunity of using such tool
Please could you help me by responding to my questions :
How could I make Neato as default layout algorithm ? If there is no way : is making new layout (by editing settings ) after the basic one (hierarchical) provide good results in term of readability of graph and could it let the same properties of the graph(labels , colors , shapes ..) ( I am trying to layout graph up to 500 nodes ) ?
I have seen in the internet some source code of GraphVzio do you think that editing the code in order to make Neato or FDP the default engine is possible ? And could you please tell me some hints for doing this .. I really need this feature and I can invest time to develop such module .
Please reply to my questions if you could as soon as possible.
Thank you again
Best Regards
For me nothing happens when opening Visio. I checked the add-ins and it tells me a runtime error occurred during loading the adxloader64.dll.
Now I am confused, because on your main page you mention that all versions are support, but in your blog entry from 12/05/2014 you claim it does nit work with 64bit Visio.
I am running Visio 2013 64bit.
No, sorry
Sorry for the delay.
Fixed.
http://www.calvert.ch/graphvizio/download.php?get=graphvizio.zip is broken can you fix it? thanks!
This is Really great software, Does this tool also handle the creation of Class models from the Graphviz, PlantUML functionality… or is there a way that I can edit to enhance for this functionality.
Thanks!
An oversight on my part, the graph name is indeed an optional token, which I mistakenly coded as mandatory. Sorry about that, but a pain to fix as I’d have to regenerate the gv parser.
Hierarchical is unfortunately a hard-wired default when importing, sorry.
‘Flat’ is more readable name for Graphviz’s neato Algorithm. The algorithms are:
You can read all the gory details here
Also just a heads up, it seems that the email address that GraphVizio wants to send error reports to doesn’t work anymore (graphvizio@calvert.ch). I’ve had it crash a couple times when I try to import a Graphviz file with an unnamed graph (e.g. graph { … } instead of graph G { … }). Other Graphviz tools that I’ve worked with don’t have a problem with this so it seems like this would be supported ideally.
Here’s the exception detail:
SyntaxError in C:\Users\ameyers\AppData\Local\Temp\tmp32EE.tmp.txt at line 0 column 6 token ‘-, ‘+’, float, integer, stringlit, variable’. Valid tokens : [no valid symbols]Stack trace: at GraphVizio.DotParser.ParseFile(String ifile) at GraphVizio.DotParser.LoadDOT(String ifile) at GraphVizio._ReadDOT.ReadDOT(String dotfile) at GraphVizio._ImportDOT.ImportDOTandDraw() at GraphVizio.DispatchWithProgress_.Worker.DoWork()
First I just want to say that this add-in is awesome. DOT graphs are easy to create in code and having an easy way to get this into Visio is extremely useful.
There’s one thing that I’m running into — I’d really love to use the “flat” layout algorithm by default rather than “hierarchical”. I’m visualizing primarily undirected graphs and the hierarchical algorithm just makes a mess of them. Right now, every time I import a .gv file I have to wait for it to layout using hierarchical, then click Flat, then layout again. It would be great to be able to layout as Flat by default.
Also, for curiosity, how are you getting GraphViz to use the “flat” algorithm? I haven’t managed to reproduce results similar to the “Flat” algorithm using GraphViz directly? I have a scenario where I would like to be able to use GraphViz directly as well so I’m just wondering.
Thanks for all your effort on this amazing plugin!
I’ve added a message which asks you if you want to keep waiting, every minute. Download the new version from here and let me know if it works for you?
That (having Graphvisio ask for an additional delay) would be great for “large” runs!
I actually found some issues in my gv file–had edges defined, but not the corresponding nodes.
I can see where that would result in a hang/loop situation (it can’t resolve the edges).
Thanks for the quick reply!
This behaviour is ‘by design’; I went on the premise that a graph whose layout took more than 60 seconds had gone into a loop (this has happened).
Ideally, GraphVizio should say something on the lines of ’60 seconds have passed, do you want to allow another 60?’. This would require a minor change; let me know if it would be satisfactory?
Having what I think is a timeout issue with a medium-large sized gv txt file (1700 edges, 790 nodes).
When I “Import Graphviz”, it runs for 60 seconds, then pops up with the this error message:
dot didn’t terminate. commandline: “C:\Program Files (x86)\Graphviz2.38\bin\dot.exe” -Goverlap=prism -Grankdir=TB -Gstart=2 q o”C:\Users\Dave\AppData\Local\Temp\tmp4013.tmp” “E:\DocRef.gv”
The reason I think it is a timeout is it is almost exactly a minute each time. And, it does run to completion (with a very nice diagram!) if I cut out 2/3 of my data… Seems either memory or timeout dependent… Memory in this case is NOT an issue (unless the plug-in or Visio have memory constraints).
Any ideas?
Thanks for a wonderful and very, very useful product!!
No, I’m afraid not, simply because it uses Graphviz, which is a 32-bit application.
Sorry about that.
Hi Maurice,
Great work! I tried to use it with Visio 2013 64bit, but it does’t work with add-on loading failed.
Does it support Visio 2013 64bit?
Thanks,
XingAn
You can do this quite simply yourself, as explained in post #65 above.
For the bonus, sorry, but the concept of port numbers simply doesn’t have an equivalent in Visio.
Excellent Tool! Confirmed Win7/Visio 2005 Architect (standard MSDN subscription available Visio).
Feature Request:
Server shapes, or some type of approach from .dot to this tool to render for server/network graphs and their relations.
Bonus: Some way to deal with port numbers either on the lines themselves, or as boxes around the servers (so all the lines go to the same port number/box, but a different port number/box when different…location of ‘port box’ around server can vary).
Using this for server/network/data flow diagrams has huge potential!
-D
Brilliant, many thanks!
Laura
The latest version is available here
Hi again,
Thanks for the response. I work on the same project as Malcolm, who posted a couple of comments some time ago in this thread. As he mentioned, we added some code to the original version so we could fire it from the command line. We’ve recently bumped into some issues with restricted character sets and noticed you had mentioned that there was a version that supports UTF-8, which the version we have doesn’t seem to do. However, we need the command line access as well so we were hoping we’d be able to recompile the newer source with the same tweaks we added before to allow command line automation 🙂
Cheers,
Laura
Graphvizio.vss is in C:\Users\[USERID]\Application Data\GraphVizio\GraphVizio\graphvizio. GraphVizio found the VSS, but couldn’t find the shape called ‘record’ there. This is normal because records are not supported, there is no straightforward way to render them in Vizio. Sorry.
Hi Laura,
no, the version on SourceForge is quite dated and I haven’t gotten around to updating it.
Any particular reason why you need the source?
‘Couldn’t find shape ‘record’ in C:\…\GraphVisio\GraphVizio.vss. Using ‘box’…I could not see a file named GraphVizio.vss at all. should i reinstall?
Hi Maurice,
Firstly I’d like to say thanks very much for writing this and making it publicly available, it’s been invaluable to a project I’ve been working on 🙂
I’d just like to ask if the source code linked in the comments above is up to date? The SourceForge folder has a last modified date of 2011-06-16, whereas the downloaded installer is dated 2013-12-01?
Many thanks,
Laura
Graphviz looks in Program Files (x86) for a directory whose name starts with “Graphviz” and takes the first one it finds.
The simplest is to install GraphViz in the default locaton.
This is probably not the best solution but it works quickly for 99% of users.
Hello maurice,
My GraphViz is installed not in c:\Program Files. Is there any possibility to set up GraphVizio so that it knows where my GraphViz is actually installed?
Thanks in advance,
Dmitry
Hello. I don’t mean to gush, but this is the COOLEST tool I can remember downloading in a long time. Thank you so much for it, I estimate it is saving me weeks of PhD work. Thank you!!!!
This is exactly what I’ve been looking for for years of messing about with GraphViz and Vision and wanting them to play nicely together. Brilliant work! Thank you so much!
Could you send me adxloader.log and adxregistrator.log, which should be in “My Documents/Add-in Express”?
Doesn’t seem to load in Visio Professional 2013 on Windows 8.1 🙁 Perhaps I’ll build the code to see what is failing. Any ideas?
Perfect, now it’s working =D
Thank you for your help.
Below is the diagram that I realized thanks to your tool :
http://img11.hostingpics.net/pics/834010graphvizio.jpg
In your image 63053, you are looking in
C:\Program Files\GraphVizio\GraphVizioYou should be looking in
C:\Users\[userid]\AppData\Roaming\GraphVizio\GraphVizio\graphvizioWhere [userid] is your Windows logon name
I don’t know why the images didn’t came with my post.
Here are the links of my images :
http://imagik.fr/view-rl/63052
http://imagik.fr/view-rl/63053
http://imagik.fr/view-rl/63054
Thank you Maurice for your quick answer.
Unfortunately it’s steel doesn’t work. Maybe I may forgot something…
To make sur that I didn’t make something wrong I restarted the installation of the plugin.
Here is the error that I get :
Here is the content of the folder that GraphVizio is looking for :
And here is the content of the GraphVizio.vss that I manually created and add to my folder that by default doesn’t have…
Please help me to solve this problem.
I wish you a good day =D
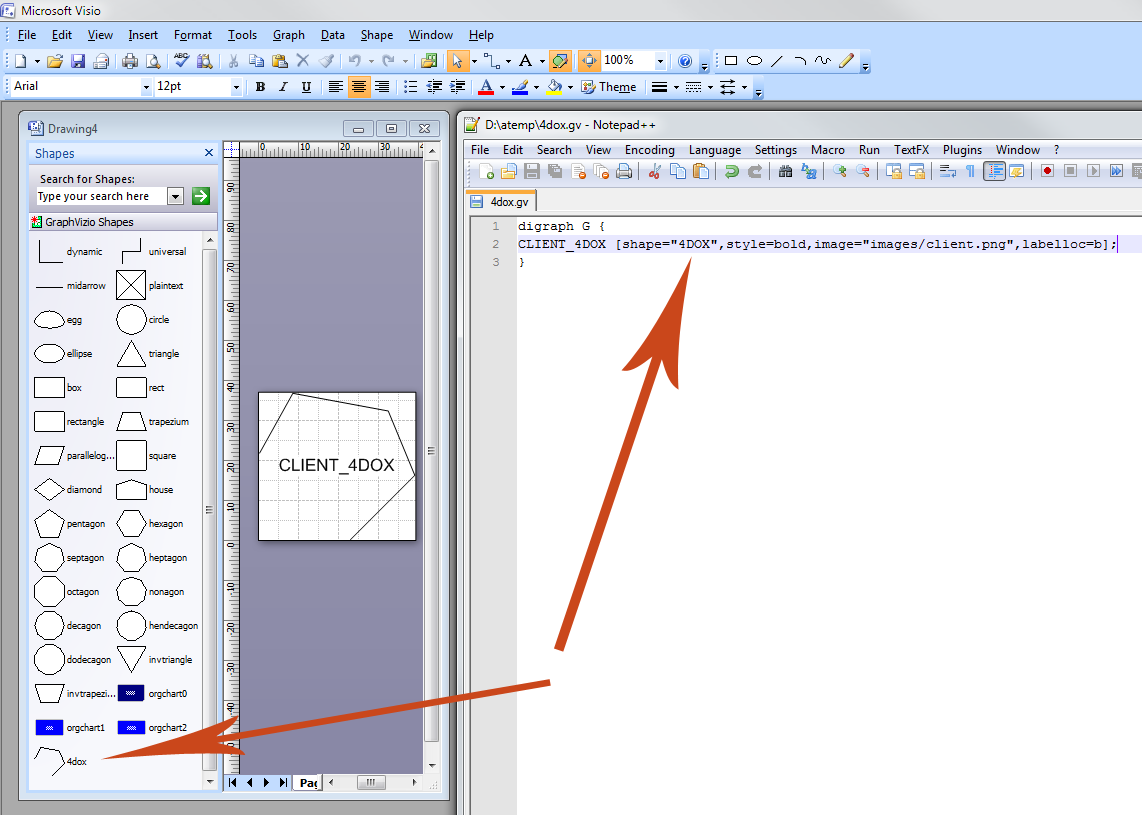
The filename in the message box is too long and gets truncated. The VSS file is
If you add your shape to that stencil, it will work:
Hi Maurice,
Thank you for your tool it is amazing.
I just have a question, how can we do to put instead of classic shape our own shape.
Ex in my dot file :
digraph G {
“CLIENT 4DOX”[shape=”4DOX”,style=bold,image=”images/client.png”,labelloc=b];
.
.
.
.
.
I’ve got this error message : Couldn’t find shape ‘4DOX’ in visio Stencil C:\Users…………graphvisio\GraphVizio.vss
Then I tried to add this shape into the GraphVizio.vss but it still doesn’t work.
Have you got an idea please ?
Hi Jon,
thanks for the info, impressive bit of debugging you did there!
Indeed, I spotted the UTF8 BOM a while ago, I’ve coded the fix and doing some regression testing.
I’ll let you know hwne I release a new version.
I can report that the U+FEFF thing was the problem: I wrote a little C# wrapper for dot.exe that stripped the first three bytes out of GraphVizioIn.txt, then invokes dot-real.exe, passing along the arguments from GraphVizio, and adding a -Kdot (since the renamed GraphViz can no longer infer its operating mode from its executable name). That was enough to get GraphVizio putting some graphs on the screen. Yahoo! Maurice, this bug should be a really easy fix from inside the actual add-in.
Thanks for writing GraphVizio — now that I have it running, I look forward to seeing what it can do!
Sorry, that last post was confusing because HTML ate the angle brackets that I pasted in. The mystery first line is:
<U+FEFF> graph RootGraph {
I’m also getting that error (on Win8.1 / Office 2013). I captured the graphvis command line with ProcessMonitor, and tried running it myself, without the -q option:
$ /cygdrive/c/Program\ Files\ \(x86\)/Graphviz2.34/bin/dot.exe -Gcharset=latin1 -Goverlap=prism -Grankdir=TB -Gstart=3 -obar.txt foo.txt
Warning: foo.txt:1: syntax error in line 1 near ‘’
It was upset about the input file, and hence never generating an output. The input file starts like this:
graph RootGraph {
…which, I learn through a few seconds’ Googling, is a “UTF8 BOM” — apparently somewhere in the file I/O stack under GraphVizio, some tool is helpfully emitting this extra UTF8 metadata that’s confusing GraphViz. Hopefully this will make it easy for Maurice to fix. I look forward to trying it!
I too get the error
“C:\Users\myUsername\AppData\Local\Temp\GraphVizioOut.txt not found (ReadDOT)”
any solution?
I’ve got the same “GraphVizioOut.txt not found (ReadDOT)” error message trying to import data from the csv file. Waiting for a fix with patience.
And is there a possibility to apply Graph layout using data from external connections? I’ve got a list with data in SharePoint and would like to draw a graph diagam using it as a source.
Sorry, this problem has been happening occasionally over the last few months and it’s on my list of things to do.
Unfortunately I’m quite busy these days so I can’t promise a date for the fix.
I’ll post here and send you an email when it’s done.
Hi, I’m trying to use Graphvizio with DOT documents contained Korean
Graphvizio operate properly without some error in case of DOT documents written in “ONLY English”
unfortunately, It occur an error with message that is
“C:\Users\myUsername\AppData\Local\Temp\GraphVizioOut.txt not found (ReadDOT)”
same error is occured when I use not only my file but also example written in this page.
My PC’s setting is below that
OS: Windows7 Professional 64bit
Graphviz 2.32 installed
Graphvizio 1.1.6 installed
+ when I install Grapahviz 2.28, graphvizio occur error message that is
“Syntax Error in C:\Users\myUsername\AppData\Local\Temp\GraphVizioOut.txt.txt at line # token “”. Valid tokens :”
A sentence which is written in line # in file ‘GraphVizioOut.txt.txt’ is contained languages except for English.
what is my problem? please let me know about it
Thanks.
2.32 is available on
Where can I find the graphvizio 1.1.5 that can handle UTF-8 character set ?
The version of graphvizio-zip file linked in this page is 1.1.4 so that it cannot handle the sample DOT file with Japanese character as shown in this page.
In the Graph Menu -> Diagram -> Import Graphviz
I am trying to install the GraphVisio software.
I installed Graphviz.
I have MS .NET framework 4 installed.
I downloaded and installed GraphVizio by downloading the file, double clicking it, and running the installation executable.
After all of this, I am opening Visio, and trying to open a dot file someone gave me. I have not been able to do this. Is there a way I can tell if the GraphVizio addon is installed correctly? I am trying to open the dot file using the file->open menus in Visio. Is this the correct way to do this?
Loren
I understand your problem, and I am aware of the issues with Russian encoding (I speak a little Russian).
To the best of my knowledge, it would be difficult to add support for character sets other than UTF8.
Sorry about that.
Would you please add native Win1251 support for Russian language?
You see, we DO NOT use UTF-8. And it adds a lot of problems trying to use Office output procedures for UTF-8.
Absolutely amazing! Thank you SO much!
It turns out the addinsexpress framework exposes the core object of the addin via the comaddins collection so we were able to simply add a method to that opject that took a filename (rather than the method already there that prompts for it) and then we could write an external VB.NET program that took a filename, automated visio, queried the extensions collection and opened it. When I am in the office I will dig out the code.
Glad you managed. How did you do it?
Just to follow up comments #36 and #37 we have managed to set things up so we can use COM automation to import the gv file into visio
no, I’m afraid not, GraphVIzio is a WYSIWYG tool, whose whole aim was to avoid command-line tools like graphviz.
Could it be possible to generate a command-line version of graphvisio that allows you to generate VDX from the command line.
I noticed graphviz contains a visio library but it isn’t included in the final release version and I don’t seem to find a version of graphviz that includes it…
Useful stuff, but the theme don’t display correctly on my Powerbook…maybe you need to verify that out. Thanks, anyway.
We ended up buying add in express and have been able to sort our problems
A coleague has pointed out that the bug I am suggesting in SizeShape makes size to fit put all text into square boxes rather than probably being the problem with the original load.
To clarify, I would expect
shape.CellsU(“Height”).FormulaForceU = Convert.ToString(width, CultureInfo.InvariantCulture)to refer to
heightnotwidthI don’t know if I am doing something wrong, but all of my boxes are having their width set from the text (or maybe graphviz) but it appears their height is taken from a fixed aspect ratio, unlike the height I see in graphviz. (So long labels get tall boxes, labels with lots of short lines get boxes that are too short)
[And size to fit seems to do the same]
I think it may be a bug and because
Private Sub SizeShape(ByVal shape As Shape, ByVal width As Double, ByVal height As Double)
Dim oldwidth As Double = shape.CellsU(“Width”).ResultIU
Dim oldheight As Double = shape.CellsU(“Height”).ResultIU
Dim oldvalue As Double
Dim cellname As String
shape.CellsU(“Width”).FormulaForceU = Convert.ToString(width, CultureInfo.InvariantCulture)
shape.CellsU(“Height”).FormulaForceU = Convert.ToString(width, CultureInfo.InvariantCulture)
repeats width
Thanks a lot for that impressing Visio Add-In! Just starting to get into GraphViz.
I’ve noticed two things: If I had not installed GraphViz the GraphVizio introduction is messy (of course). Some of the help-samples are missing e.g. for “Keep shapes togehter in groups” is missing \AppData\Roaming\GraphVisio\threecountries.vsd.
best regards
I’m afraid not, sorry, it would require quite a lot of work to provide this kind of automation.
Is it possible to automatically open a .gv file (I would like to display a dot file in visio using something like double click or COM automation)
(I like graphvizio but am wondering if I can save the user a manual step)
I’m afraid Graphvizio can’t handle HTML labels or Graphviz records, neither have an easy correspondence in Visio.
Sorry about that.
At the end of the install, Visio starts and a live WYSIWYG tutorial shows you how the program works. A series of tutorials covering the major features is available under Graph -> Help -> How Do I?
The complete source code is available on SourceForge
Maurice,
Hello and thanks for createing Graphvizio. I hope to give it a test drive some time. Where is the best place to find documentation? Also, has the project moved to sourceforge?
Thanks,
Dan
Grapvizio is very impressive and one of my favorites!
Is it possibe to include HTML tags as is done in the example below?
Using GVedit (Graphviz 2.2.8) I get the results I want but I would like to use Graphvizio to import the .dot file in Visio.
Thanks,
Hessel.
digraph structs {
splines = ortho;
node [shape=box, fontname = "Arial", fontsize=9];
PC1;
PC2;
PC3;
PC4;
PC5;
PC6;
PC11;
PC12;
PC13;
PC14;
PC15;
PC16;
node [shape=box3d];
Server;
node [shape=trapezium];
Printer1;
Printer2;
node [shape=circle];
Router1;
Router2;
node [shape=none, height=0.1];
struct1 [ label=<
0001020304
0506070809
1011121314
15161718>];
struct2 [ label=<
0001G020304
0506G070809
1011G121314
1516G1718>];
Router1 -> Router2[arrowhead = none];
PC1 -> struct1:f01[arrowhead = none];
PC3 -> struct1:f05[arrowhead = none];
PC5 -> struct1:f09[arrowhead = none];
Server -> struct1:f13[arrowhead = none];
Printer1 -> struct1:f17 [arrowhead = none];
struct1:f03 -> PC2 [arrowhead = none];
struct1:f07 -> PC4 [arrowhead = none];
struct1:f11 -> PC6 [arrowhead = none];
struct1:f15 -> Router1[arrowhead = none];
PC11 -> struct2:f01[arrowhead = none];
PC13 -> struct2:f05[arrowhead = none];
PC15 -> struct2:f09[arrowhead = none];
Router2 -> struct2:f17[arrowhead = none];
struct2:f03 -> PC12 [arrowhead = none];
struct2:f07 -> PC14 [arrowhead = none];
struct2:f11 -> PC16 [arrowhead = none];
struct2:f15 -> Printer2 [arrowhead = none];
}
Graphvizio uses graphviz to layout diagrams. To find the latest version of Graphviz on your PC, it looks for directories starting with “Graphviz” (excluding those starting with “Graphvizio”) in “Program Files”. Windows potentially has 2 special folders called “Program Files”, by default the first is “C:\Program Files” and the other is “C:\Program Files (x86)” if you have a 64-bit system.
The Graphviz files are in a directory called “GraphvizXX.YY”, where XX.YY is the version. Graphvizio takes the highest-numbered one, which should be the latest version of Graphviz on your system. This directory must contain a “bin” directory, which must contain the Graphviz binaries.
You should check:
What is the registry setting
HKEY_LOCAL_MACHINE\SOFTWARE\Microsoft\Windows\CurrentVersion\ProgramFilesDir?(It should be “C:\Program Files” or something similar)
What is the registry setting
HKEY_LOCAL_MACHINE\SOFTWARE\Microsoft\Windows\CurrentVersion\ProgramFilesDir (x86)
? (It should be “C:\Program Files (x86)” or something similar)Do you have any other files or directories in either of the “Program Files” whose name begins with “Graphviz” and is not the result of a Graphiv install? (If so, rename or move them)
Hi. I recently came across GraphVizio and am looking forward to working with it. I installed it into Visio 2003. When I try to import a GraphViz file I get the following error:
“Error locating GraphViz in Program Files: The path is not of a legal form”
Any help in resolving this would be greatly appreciated.
The notion of ‘head’ and ‘tail’ doesn’t exist in Visio, so headlabel and taillabel are not supported.
Only ‘label’ is supported.
Sorry about that.
First of all, thank you very much for this fantastic plugin!!!
I have a layout with 500 links and each one in the Graphviz file has a head label and tail label, but when i import it with Graphvizio i dont see the labels in visio, are not supported??
Thanks again,
Victor
Hi Maurice
Nice tool – works well.
One issue is that with the COM addin loaded (in Visio 32 bit on Win7 64 bit), any diagram that is opened seems to get marked as “dirty” and requires to be saved. On the Undo menu there is a “Set Formula” call which can be undone.
If I disable the addin, then the above doesn’t happen.
This is using 1.1.1.0
Thoughts?
Robert
Thank you for the effort poured into the tool!
This is normal, Graphvizio does not support records.
You’re not the first to ask and I would have liked to implement records, but it would be a very challenging task which would involve imitating records with grouped shapes.
Sorry about that.
I was looking for a way to import GraphViz-Files to Visio.
Your solution sounds great, so I installed GraphVizio.
Unfortunately I had a problem, when I tried to import a GraphViz-File. I got an error-message:
Couldn’t find shape ‘record’ in Visio Stencil C:\Program Files (x86)\GraphVizio\GraphVizio\GraphVizio.vss
As far as I can see GraphVizio.vss doesn’t exist at all.
Neither are issues.
1. When Graphvizio reads a diagram to layout, it only considers shapes and connectors that have at least one connection to something. This is by design, due to the differences between Graphviz and Visio. A Visio diagram may contain headers, footers and so forth, which must not participate in layout. Such shapes are identified as such precisely because they are not connected.
2. To make Graphvizio layout left-to-right, use Graph->Settings->Diagram->Rank Direction->Left-to-right. This adds rankdir=LR.
HTH,
Maurice
Thanks for your hint via email. I’ve called the export via menu Graph->Diagram->ExportGraphviz and it works now… except these 2 issues:
1. single states which are not connected to other states by arrows are missing in the graphviz file.
2. I had a Visio graph from left to right but Graphviz display it from top to bottom, although generally Graphviz supports such alignment via: rankdir=LR;
Would be cool if you fixed it… 😉
Anyway, good work, thanks a lot!
I installed your stuff but cannot find the file type .dot in the “File Save As…” dialog. Why? Do I have to install graphviz on the Visio machine, too? It would be cool to have a short tutorial. Please, help! Your tool is highly appretiated.
Now, if it would only understand ports …
Fantastic!
I have a .net application, which creates a DOT file as a directed graph with nodes and edges by reading from an access database. It is not an organization data, but a hierarchical – parent to multiple children to their children and so on and on. Is there anyway to automatically read the DOT file and use graphvizio automation to layout my nodes ?? I do not like to see orgdata stencils or templates used. thank you – jay
Hi,
Nice work with the add-in.
A question though. I have a perl script which creates visio xml groups to match certain kind of dot records. Now, when I run GraphVizio on those groups all the things inside the group are also rearanged (connection points, texts, etc..). How hard would it be to change the code such that It would only reposition instances of one master shape? I.e. it would only reposition the blocks that have text inside them.
–Jouko
Thank you for making this available. I am amazed at what is possible using this plugin. To be able to generate a graph using relationships entered into a dot file and then import it into Visio for further tweaking makes for the perfect diagramming tool.
Oh, I found the sourcecode
http://sourceforge.net/projects/graphvizio/
If the plugin won’t work out I wouldn’t mind a standalone program that turns .dot into .vsd, but…
…well, I’m seeing lots and lots of VB code, which fixes “quirks” and provided “challenges”, as you put it…
I think I’ll wait and hope for your next update of Graphvizio! 🙂
Uwe
Graphvizio for Visio 2010 64bit, please please make it happen! 🙂 I’m a big graphviz fan and I want to see some visio-graphviz magic to happen!
Thanks for your time and effort!
Great Effort!! I have been searching for something like for a long time.
I have a question:
My Graphviz installation is not in the standard directory under C:program Files
How do I change the settings so that Graphvizio can invoke GraphViz from my installed directory?
Thanks
Correct, HTML isn’t supported, as it doesn’t fit into the Visio way of things. Clustering IS supported, however. Could you send me an example of what you’re trying to do and I’ll see if there’s a solution?
First let me say, great effort!!!
It looks like HTML Like labels are not supported. Since clustering is not supported, any suggestions for how to graph complex shapes without using HTML like labels to have Tables?
Yes, I’m afraid I can’t provide a 64-bit version; addin express, which I use to interface to Visio doesn’t have 64-bit support.
I’ve already asked them, it would be great if you could ask as well, to try and get them to provide this.Edit 14/10/2010: Addin Express does support 64-bit as of the 2010 version. I just need to find the time to install and test…
I’m also using 64-bit Visio and after installing the add-in I don’t see it anywhere in the app.
Hi,
Is there anyway to control the size of the boxes that are drawn? Or how about causing long labels to break across multiple lines?
Nice tool!
To avoid cluttering this thread, I reply and fix questions, as opposed to comments, directly to their authors.
If you have a specific question, do feel free to contact me directly at graphvizio@calvert.ch
Hi, I’m trying to use this with a simple CSV file and it keeps showing an error that says ‘line must contain a single comma’.
Does anyone have any solution for this?
Many thanks
I do love this software. I just upgraded to a 64 bit version of 2010…and now the menu won’t show up in the add-in section.
I know you don’t support directly, but you do have any hints on how to get it to work? Or could I migrate this project forwards for you? It’s too valuable for me not to use. The 2010 auto layout is much more cumbersome.
You know, this is amazing. I hope people realize that even though it does not do everything (like the clusters above), it does sooooo very much. I am using it for PERT charts and it’s awesome.
We have a dot file that has clusters representing servers, with processes inside the server/cluster, but when using GraphVizio to import into Vizio, it drops the clusters. Any suggestions?
Thanks,
– N
Amazing! … Is there a way to make it unfuddle swimlane diagrams? It takes those and turns them into flowcharts.
My colleagues and I here in Mexico are very impressed with the solution, we applied the Add in in Visio 2010 and the results are impresive !
In just two days we were able to analyze Cobol code using the outstanding work from Graphviz team and you ! Thank you !
Astonishing! Working fine with Visio 2003 on XP. I have seen a few crashes on imports of existing dot files, but overall very good. Much better than using the cvs version of Graphviz to generate vml files to import to Visio.
A truly groundbreaking enhancement.
Thanks for all your hard work.